Description
Marketing Math Collection
The availability of analytic data and marketing models has enhanced and driven marketing forward in many ways. Sales and marketing math and analytics help to unlock commercially relevant insights, measure profitability and return on investment on different marketing strategies, thus increasing revenue and profitability, and improving brand perception. With the help of the right analytics, you can uncover new market niches, new product development opportunities and much more.
At the Business Tools Store, we have created a marketing math collection. We continue to expand the collection. If you feel there is any addition that would enhance the collection, we would be delighted to hear from you. Once developed we will give you a complimentary copy.
The complete collection is available at 25% of the total cost of the individual products, that is a massive 75% savings!
The Marketing Math Collection currently consists of:
- Customer & Market Segment Profitability Analysis.
- Breakeven Sales & Payback Calculator
- eCommerce Revenue Business Model Calculator
- Subscription based Revenue Business Model Calculator
- Customer Lifetime Value Calculator
- Sales Pipeline Requirements/Plan Calculator
- Sales Pipeline Profile Graphic Image Generator
- Exponential Smoothing Sales Forecasting System
- Distributor/marketing Channel Partner Evaluation
Customer & Market Segment Profitability Analysis.
Focusing on customer needs/wants rather than what you have/wish to sell is the very essence of marketing.
Part of the challenge is that not all potential customers want/need the same product or service. A business or commercial buyer will probably have different needs than the individual consumer. Other examples where needs frequently differ are by geography, age, ethnicity, affordability/pricing, disposable income, and lifestyle.
This calls for market segmentation, where each segment has identified needs and differences from other segments.
However, not all market segments are equally attractive.
Our Marketing Customer Segment Profitability Analysis enables profitability and investment analysis to be done and compared for four different segments.
Back to Top
Breakeven Sales & Payback Calculator
Where the unit selling price is greater than the variable cost of producing/selling a product, each unit sold contributes the difference (gross margin) to offsetting the fixed cost associated with the business.
Break-even analysis identifies the unit sales volume where the gross margin or contribution is equal to the fixed cost of the business. It is the point at which the business makes neither a profit nor a loss.
The calculation of the break-even sales volume for a single product is relatively straight forward.
However, many situations involve multiple products.
Our Break-even Sales and Payback Calculator can be used for single product and multiple product (up to five) situations.
The break-even point also reflects the payback period, i.e., how long does it take to reach the breakeven unit sales.
Multiple scenarios with different unit prices and sales units and mix can be analyzed for break-even sales volumes & revenue and payback period.
Back to Top
eCommerce Revenue Business Model Calculator
For any eCommerce business the revenue model is well defined.
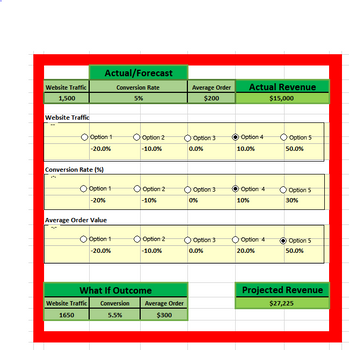
It is Revenue = Number of Site Visitors by Conversion Rate by Average Order Value.
Simultaneous growth in all three can be challenging. Frequently growth in one factor may result in a decline in one or both of the others, e.g., increase in site visitors may result in a reduction in the conversion rate.
This is a classic “What-if” scenario with revenue generated dependent on the impact and interaction of website traffic, conversion rate and average order value of the selected strategy.
Our eCommerce Revenue Business Modelling Tool, with just three clicks on our graphic interface, allows you to evaluate the revenue outcome of different assumptions and strategies.
Back to Top
Subscription based Revenue Business Model Calculator
This Excel-based What-if Subscription Revenue Model allows the user to review different Subscription scenarios and their impact on total revenue.
Subscription charging/revenue models have become the de facto pricing models for many services.
In some scenarios there may be a basic service/price and increasing incremental offerings for higher subscription rates. These are frequently designated by terms such as Bronze, Silver, Gold, and Platinum.
Our Subscription Revenue Business Model Calculator allows you to model different subscription pricing and volume scenarios and do detailed “what-if” analysis on the key variables that effect total subscription growth and revenue over a three-year period.
It is suitable for both B2C and B2B subscription scenarios.
Back to Top
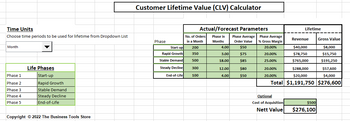
Customer Lifetime Value Calculator
Customer Lifetime Value (CLV) is the total monetary value of transactions/purchases made by a customer with your business over his entire lifetime, i.e., the time till your customer ceases to make purchases.
It is a very important business metric as it estimates how much every customer will be worth to you over the course of their lifetime with your business.
While our Customer Lifetime Value (CLV) template calculates the CLV, it goes beyond just calculating the CLV revenue, it also calculates the gross margin contributed by the customer, which provides a more complete picture of the customer value than just considering the revenue contribution. The customer acquisition cost (CAC) can also be incorporated.
Back to Top
Sales Pipeline Requirements/Plan Calculator
You have developed and got approval for your sales revenue monthly annual budget.
Ready to get started, great!!
But do you know how many opportunities/leads you need at each stage of the pipeline to meet your sales revenue budget?
Have you sufficient leads to meet your revenue budget in 3 months or 6 months time?
How many sales proposals/quotations do you need to submit this month, next month, etc.?
How many qualified leads do you need now to be able to generate the required number of sales proposals/quotations in, say, three months time?
These are all questions that the Excel-based Sales Pipeline or Sales Funnel Calculator template helps you to answer, allowing you to identify potential problems, that will impact future revenue streams, in time to take corrective action.
Sales Funnel/Sales Pipeline Template calculator identifies the number of opportunities/leads you need at each stage of the pipeline to meet your sales revenue budget.
Back to Top
Sales Pipeline Profile Graphic Image Generator
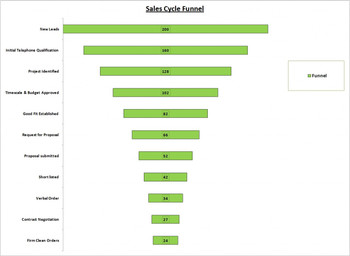
This Excel-based Sales Pipeline Funnel Image Graphic Generator template allows you to quickly review and analyse the impact of a range of options and produce a Pipeline Funnel Graphic image for your specific sales pipeline.
The template quickly answers two basic questions for you:
- Based on a specific number of New Leads how many Orders will I generate?
- How many New Leads do I need to generate a specific number of Orders?
It also automatically produces a Sales Pipeline Funnel Graphic image that shows visually the shape and metrics of the Pipeline Funnel based on your specific parameters that you have entered.
Back to Top
Exponential Smoothing Sales Forecasting System
Sales forecasting is frequently an important component of market/sales analysis. Forecasting of future sales usually uses historical sales figures as an input when projecting future sales.
The Exponential Smoothing approach assumes that more recent sales are likely to have a greater influence on calculating future sales. The technique uses exponentially decreasing weighting to historical data over time.
Seasonality of sales can also be a factor.
Our Exponential Smoothing Forecasting template uses the Exponential Smoothing Forecasting Function in Excel to build a twelve-month rolling sales forecast for an unlimited number of products. Sales seasonality is automatically detected, based on the historical sales data, or can be manually overwritten.
Where sales history data is missing, interpolation of the other data can used to fill in values for the missing data, or zero sales can be used for the missing data.
Back to Top
Distributor/marketing Channel Partner Evaluation
Entry into new markets is typically a strategic imperative for diversification and substantial growth.
For many, to rapidly scale sales revenue, initial entry is via a 3rd party .
Selecting the right 3rd party partner is critical.
Our Distributor/Marketing Channel Partner Evaluation & Selection Rating Matrix provides an effective tool to evaluate potential partners.
Detailed Partner Comparison Charts and Partner Profile Charts are produced.
By reviewing the various comparison charts created, you can quickly identify the strengths and weaknesses of each potential partner. The detailed Partner Profile Chart allows you to readily review any potential partner against the profile of your ideal marketing channel partner.
Back to Top
Need Something Different
If there is something else you would like to see included in the Marketing Math Collection please contact us. If we think that it would enhance the collection, we will develop it and give you a complementary copy as a "Thank You" for suggesting it.
No Quibble Guarantee
All our products come with a comprehensive user guide to allow you to get started right away.
Why not check out our User Guides for full details of each product.
If you are still not sure, remember all our products come with a NO QUIBBLE MONEY BACK GUARANTEE
Security and Payment
The site is fully protected using the industry leading Geo-Trust SSL system.
Payments via all major credit cards, Apple Pay and Google Pay are processed using Stripe payment processing and we also accept PayPal payments.
Once payment is processed, the items purchased can be downloaded immediately.


